Did you hear about Waterfall? No, I don’t mean the oldschool development practice of the NASA to ensure that a rocket-powered aircraft will fly in space forever.
I mean Waterfall charts:
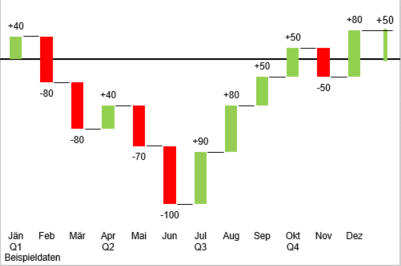
These charts do add some value for business users as they are different. They do not just show data, they show data with a certain thought in mind, that is called: Don’t make me think. Consider the data above. Instead of showing information from bottom up, letting the user guess what the difference between to blocks is, it just shows the difference visually. Additionally, it has a certain color coding that does tell everybody who ever had a bank account what is positive and what is negative. Usually red is positive… okay, you know I am kidding.
We have implemented this functionality as an Excel Addin, so it is client software. We were watching after new opportunities, one of them is Microsoft’s Graph and Excel REST API. Actually this is the API that the Excel/ Office Addin concept is based on. I consider this to be Microsoft’s try to get rid of VBA. Excel is still the most popular Office application having over 1 billion users (!), but it makes heavy use of VBA – like our piece of software does. This is actually not a problem on desktop machines but certainly it is when trying to move on to mobile machines. VBA is just not portable – file access, registry, all the dirty things you can think of.
Nevertheless, Microsoft put a lot of effort in it so I wanted to get an eye on it and my hands dirty. These would be my questions:
- What can I accomplish with that API? Which excel objects are accessible, which aren’t? Does it fit to my needs?
- Is it stable and reliable?
- Is the Office Store a valuable target?
- What kind of code needs to be written?
- Is the code portable?
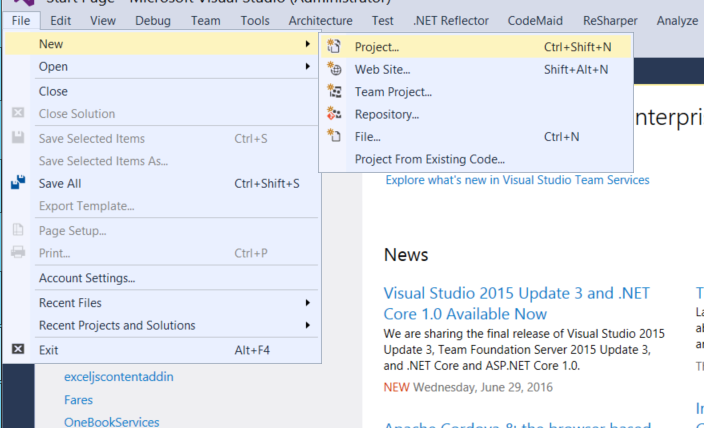
Let’s have a look onto that. Just open Visual Studio 2015, and create a new project.
Wait. Did you install these?
![]()
If you want to work with Office via Visual Studio, you certainly need a valid Office license of Office 2016 (!) and you need to install the Office Developer Tools for your very visual studio version.
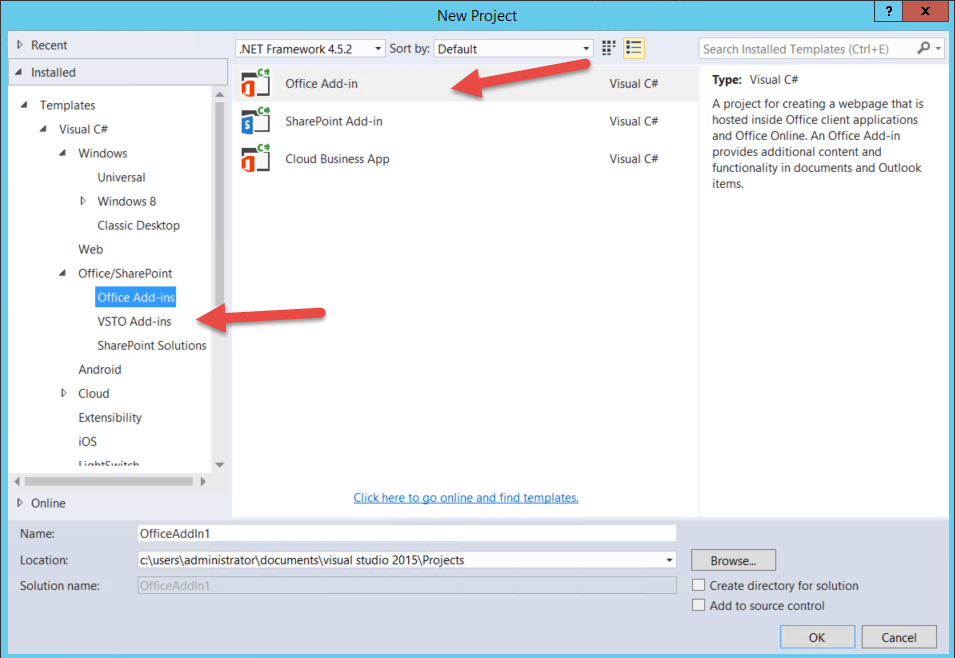
When having everything installed, it should look like above. Now take care. We are not heading for the oldschool VSTO Addins. These are exactly the addins Microsoft want to get rid of, we are heading for the category “Office Add-ins”. So just select Office Add-in under Office Add-ins, select a folder where to put the files that are going to be created and hit ok.
You are now creating an office-addin that is web based. Actually when Office hosts your code, the IE 9 engine will be used for doing so.

Just be aware of that. Yes, I also would have been more satisfied with a webkit engine. Come on, get real this is Microsoft :-D. Much better than IE7 or IE8 :-D.
You are now about to select the kind of add in that you want to implement. You may want to ask yourself how you want to help out the user.
- Do you need to show your information always, beside the actual workbook?
- How is your functionality bound to the actual data?
- Should this functionality/ visualization moveable?
Forget about “Mail” in this context, that certainly only works for outlook. Task pane add-ins allow for integrating your web-based in a task pane beside the actual workbook/ worksheet. I will no go for this functionality. Both strategies have their advantages, mainly it is about how to visualize your functionality. I am going to select content, as I want to create a waterfall chart. So go for it.
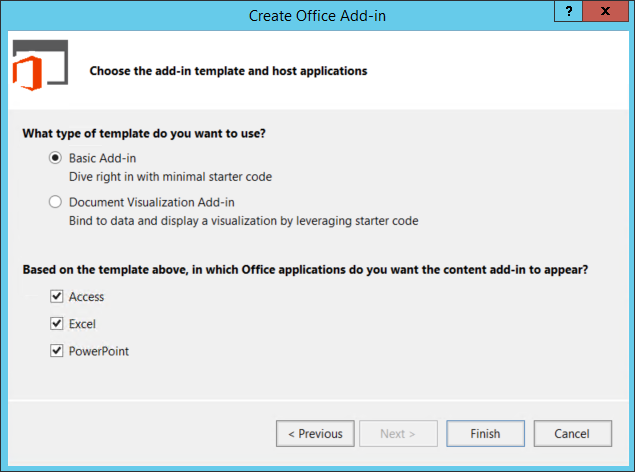
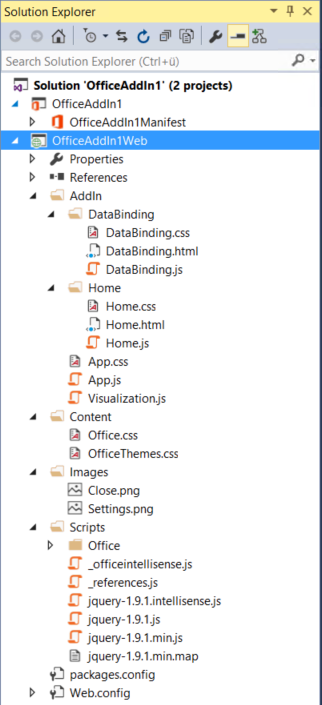
Choose the applications and the kind of code you want to start with. I did choose Excel and Document Visualization Add-in. Actually the sample code does make sense to get into it. Hit finish and have a look onto the results. Having a look onto the solution explorer it offers you a lot of files.
What is going on here?
Actually you now writing an Office Addin that is completely decoupled from Excel itself. And it is web-based. You can choose your dead your kind of tools how you want to develop it. Microsoft offers you the Excel REST API to interact with Excel itself. As you can see, also jquery is a standard like it is in ASP.NET MVC for a long time now. Don’t think about the details, just hit f5. You’ll see the following, quite usable sample:

This is it. A content control place on your worksheet containing the web-based implementation. That is not bad – even when I considered content controls to be evil. In former versions of Excel, these content controls have been a pretty good garantuee to let Excel crash soon or later. Let’s ignore that for a moment and hit Insert sample data.
This will
- access Excel from your web-based content control
- add some values to cells
- add data binding to these cells that changes are automatically snychronized in your application
- and creates a simple chart
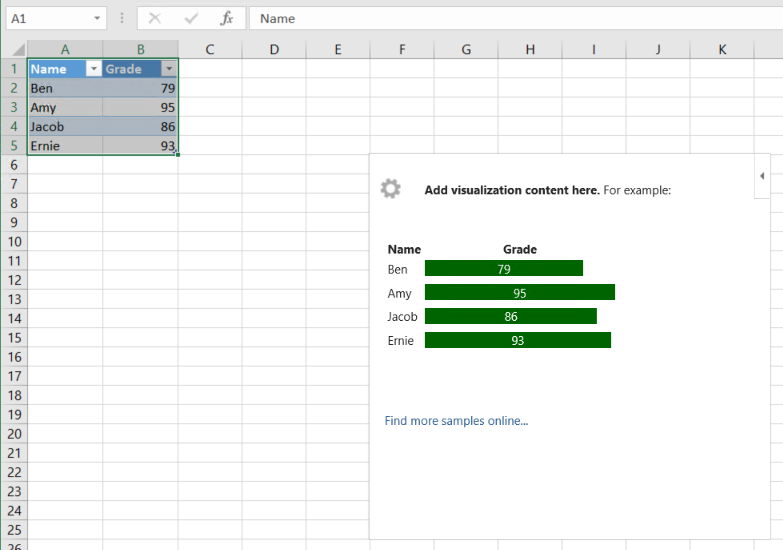
It does look promising, doesn’t it? It can do data-binding, and it can visualize a chart. Perfect start-up for me to get a waterfall chart implemented. Just closed Excel and … mh.
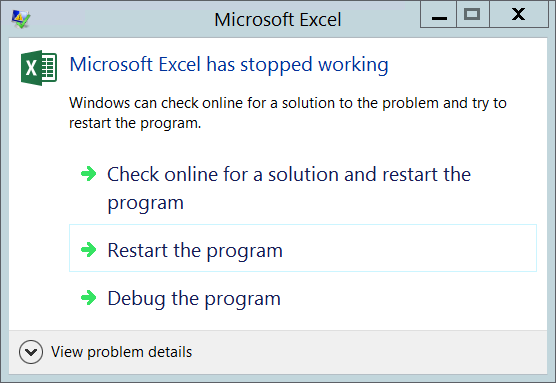
Just crashed. Great. Looks stable, right?

Unluckily this is not a rare problem, it occurs pretty much on every try to close Excel. It does happens less often, when you stop debugging in Visual Studio, though.
Anyway, let’s play around with it and try out debugging. Put a breakpoint anywhere in your Javascript code. Start it up again. Most interesting parts here are visualization.js and databinding.js, but we also have to consider Home.js. I actually have to confess that I always tried to avoid debugging javascript code within Visual Studio. I really prefer to debug directly in browser. Chrome does a very good job it in, Firefox lost a little since the good old times when Firebug had been leading edge. Even IE improved, but is still not my first choice.
The office startup function is defined in Home.js.
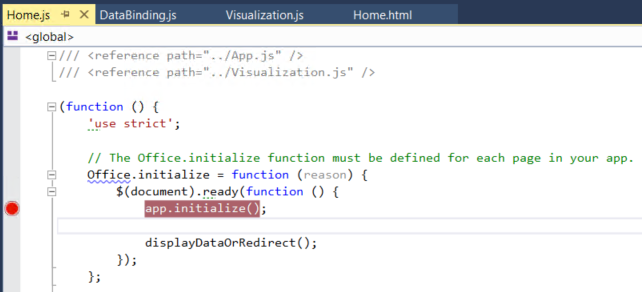
This method will be called when Office is initialized. You should include waiting for DOM and document being ready. Out-of-the-box, Office uses jQuery, so you may be used to the ready method of jQuery that will allow you to.
The funny thing is, it works fine with the sample. It is fast and reliable. I took another step and incorporated my 5 cent to make the waterfall chart being available. I needed to include d3js library and found a good startup to create waterfall charts from nautilytics and visible.io. There are more samples to be found.
It is not too drastic complexity I added here. But Visual Studio started… to get slow. Doesn’t execute single steps when debugging or needed ages for it. I had to stop it over and over again. Visual Studio even crashed multiple times. Anyway, there have been two things I was nerved about:
- It doesn’t make sense to use Visual Studio to put together some simple charts. Studio is just too huge, too slow.
- The stability of the Office API is some kind of … improvable. But it is mainly not needed for the overall creation of the chart itself.
So I started to make use of Visual Studio Code.
That’s lean! Too make it fast I just need another… piece. Visual Studio Code has no IIS integration at all. It is just what it should be: A lean, smart text editor. How can I debug my javascript code, how do I get it hosted? The answer is simple.
Just install Nodejs. You may recognized the small command “installnodejs.cmd” in the screenshot above. It installs the necessary modules in that directory. All you need to do to make the magic happen is to start a console right in that directory, and type “npm start”.
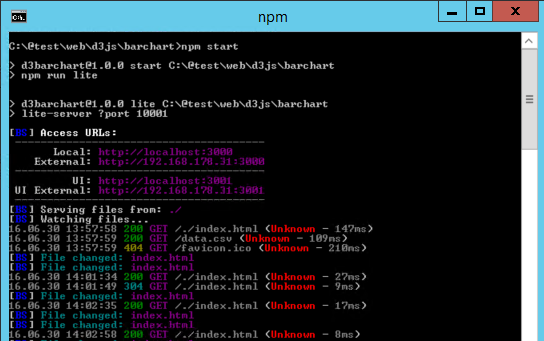
The nodejs server will be started and watched. The latter means, if you change any file in that directory it will lead to a refresh of you page if you have it opened in any browser. So when you hit ctrl+s in Visual Studio code and <alt><tab> to go to your browser page, it is already loaded or waiting for you in debugging mode of the browser. This is much more comfortable than doing it in Visual Studio. And way faster.
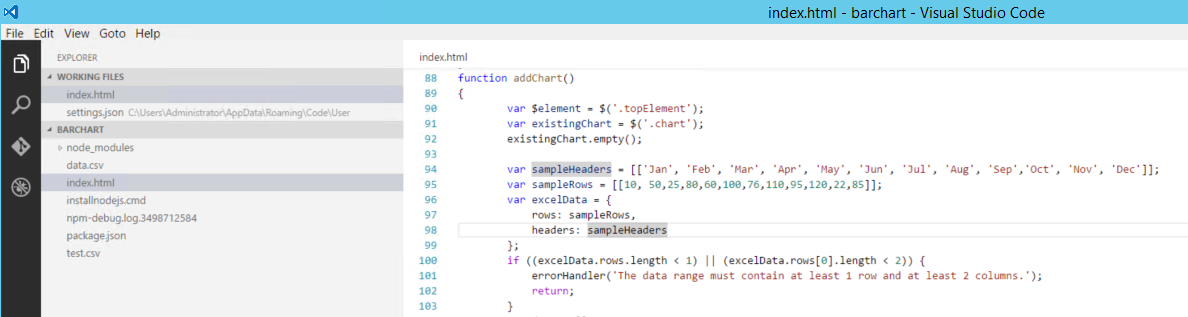
Certainly you should take care that your implementation is data driven. What do I mean with that? Do your implementation based on data, have a clear definition of what is expected by your code. This is anyway a good practive, isn’t it?
You need to define clear abstractions, what kind of data you want to consume. In the screenshot above, you can see the definition of sampleHeaders and sampleRows. This is put into another class called excelData. That is exactly what Excel will provide for you. This is the easy way, just expecting that data will be provided like Excel does – for a chart it does make sense as you will need exactly these two pieces of information.
This makes it possible to use your code in any web page, expecting you can provide the same data in different places. You can push it to a PowerBi visualization or just use it with Excel REST API. This is the beauty of the web world, it is portable.
And exactly this is what I do like with the procedure and direction Microsoft is going for. You may want to use the Excel REST api only when you are integrated in that environment. Prepare your code to be remote controlled and be placed into different. Then it is going to be pretty flexible and you will write code just for “Excel Addin” platform anymore.
That’s great!
To answer the questions from above:
What can I accomplish with that API? Which excel objects are accessible, which aren’t? Does it fit to my needs?
This is still far away from supporting the complete Excel object model. I guess the complete functionality will never happen. You’ll get a good overview here.
Is it stable and reliable?
Let’ say partly. It is good enough to try it out and produce some stunning functionalities.
Is the Office Store a valuable target?
Actually the Office Store is not that crowded at the moment, and it probably will not. There is a good chance that people will have more interest on it due to better supported functionalities.
What kind of code needs to be written?
As stated above, it is completely web-driven code. And that’s great.
Is the code portable?
Absolutely!
… [Trackback]
[…] Read More Infos here: codingsoul.de/2016/07/04/microsoft-graph-excel-api-waterfall-charts-with-d3js-as-office-365-addin-is-that-already-stable/ […]