I am currently working onto a project that targets Azure Cloud as data storage as well as using the strong infrastructure capabilities for scaling services up for up to 2000 calls a second.
While we are not ready for that massive amount of calls, me and my team put the functionality together. When doing so, the Azure Compute and Storage Emulator does a pretty good job when running our code locally. Beside some components like the Service Bus and Redis cache, pretty much everything can be emulated and tested without being connected to the cloud.
Even if the Emulator does a good job, there is no garantuee that this code will also work in the cloud. Logging functionality – in our case the System Diagnostics Trace functionality hidden behind a log4net-like interface – is a must. We log in every method, and every ctor. That makes it possible to find out pretty much everything by just viewing the log file, or at least getting a very good idea where to look.
And there we are, the log file didn’t tell enough, what now?
Certainly Microsoft cooked something for us: For debugging azure worker roles as well as for debugging azure web roles it shall be possible to directly attach to the processes of the machine in the cloud. Azure remote debugging as it’s best? Let’s check it out. Open the Server Explorer via view menu and expand the Azure node, after that the Cloud Services node where all the deployed services are available:
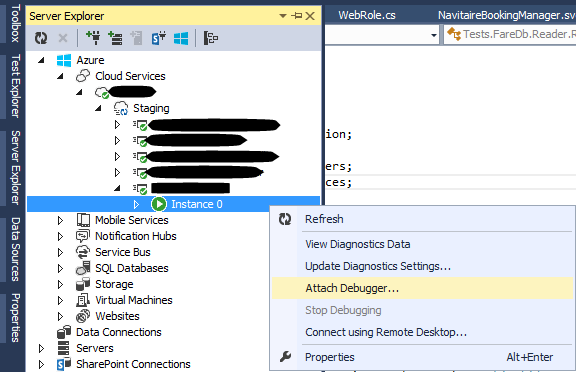
The Server Explorer? I didn’t have too much need to use this tool in Visual Studio in the last years. I worked a lot with SqlServer, did SharePoint projects and a lot of other stuff, but I always ignored it. Now, Server Explorer is your friend. It gives you an overview about every created object in the cloud, makes it accessible and even tells you something about the status.
To attach to one of them, just right mouse click on your azure web role or azure worker role and click Attach Debugger.
The usual dialog appears:
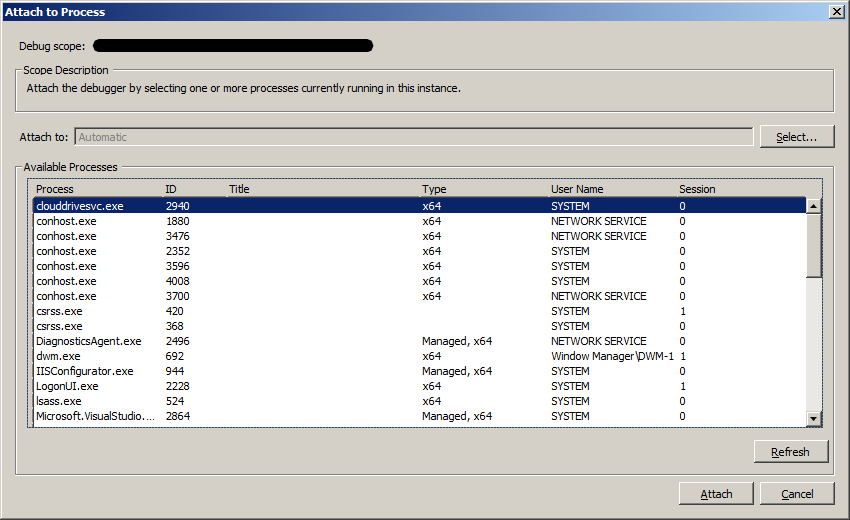
There is no information which files to attach to, it tells you which cloud service you selected though. So the first try just leaving it as it is starts the Visual Studio debugging session, but breakpoints will indicate that nothing have been loaded and you cannot debug.
Let’s try again. Select these files, keep control key down to select single processes:
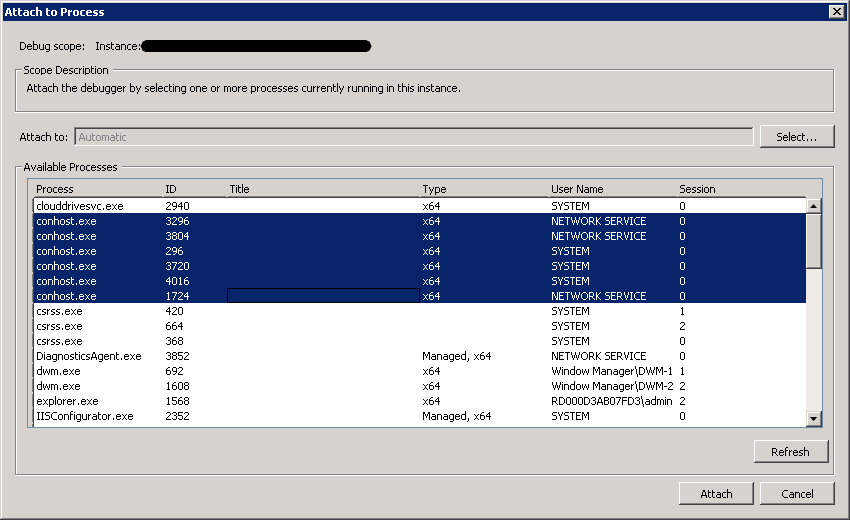
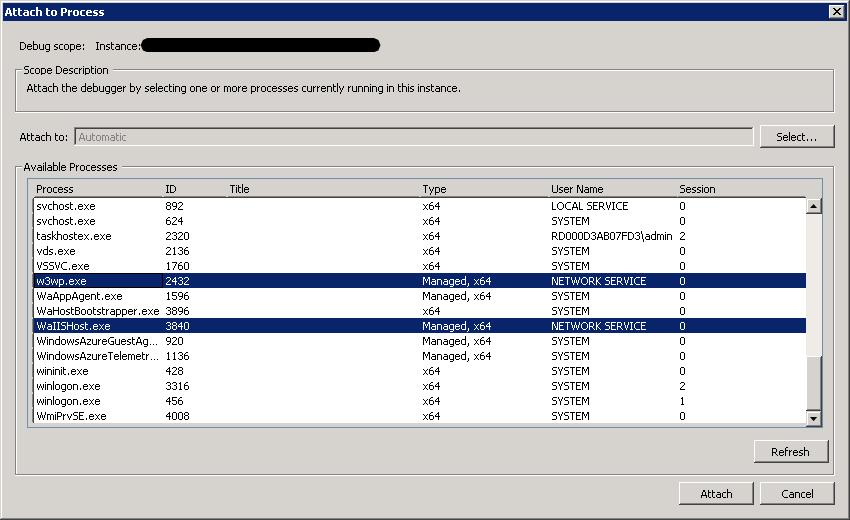
Possibly it is not necessary to attach to all conhosts for debugging azure worker roles and azure web roles but this does the trick for me. If you experience how to detect which conhost to choose, let me now. Actually WaIISHost.exe and w3wp.exe have to be selected and attached to when debugging azure web roles. If you want to debug azure worker roles, you have to attach to WaWorkerHost.exe.
As the last step you have to select which type of code you want to debug, select .net 4.0/ .net 4.5.
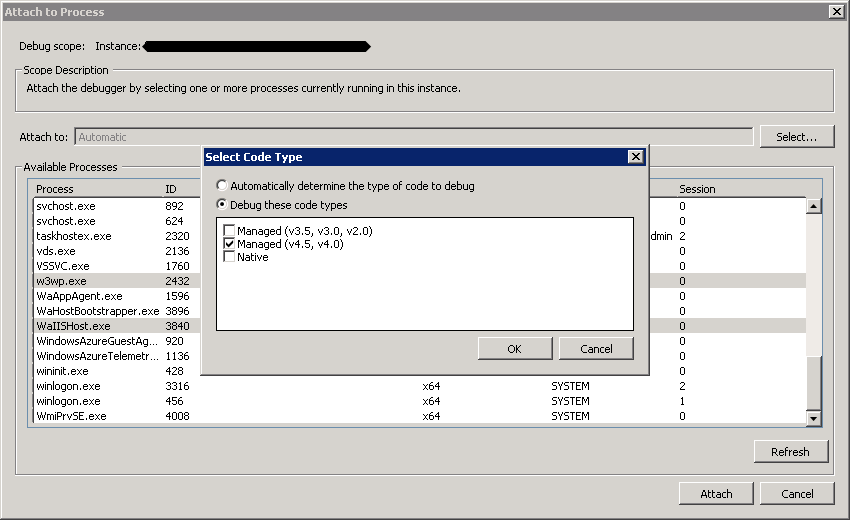
After that, just hit Attach.
Happy debugging.
Holger
You need to be a part of a contest for one of the greatest blogs on the net.
I will recommend this website!
Good post. I absolutely love this site. Thanks!
Just use VMs. Don’t use these compute PAAS offerings. I had nothing but trouble with them.
To be honest, I really believe using the infrastructure is a huge benefit. But it comes to a certain price like everything else. Just moving Client-Server technology to the cloud using vms doesn’t let you scale as you can with PAAS (think of scale out instead of scale up and down)
The cost difference between VM and PAAS is very large.